> For the complete documentation index, see [llms.txt](https://docs.reveald.com/technical-documentation/llms.txt). Markdown versions of documentation pages are available by appending `.md` to page URLs; this page is available as [Markdown](https://docs.reveald.com/technical-documentation/epiphany-workflows/technical-analysis/create-an-analysis-focused-dashboard/ticketing-widgets.md).
# Ticketing Widgets
Epiphany's dashboard includes widgets for managing tickets.
{% hint style="info" %}
Most dashboard widgets will provide helpful information as to their purpose if you roll your mouse over the Information icon .
{% endhint %}
Epiphany's ticketing system has many ways to show you data about tickets. This information helps you identify trends in the types of issues in your organization.
### New Tickets Today
This widget shows the number of tickets opened today. In this example, only two tickets were opened today. Compare this widget with the **Tickets Created by Severity** widget (below), which shows the same information but also includes a breakdown of the tickets' severity.

### Open Investigation Tickets
This widget shows the number of open investigation tickets.

### Open Risk Approval Tickets
This widget shows the number of open risk approval tickets.

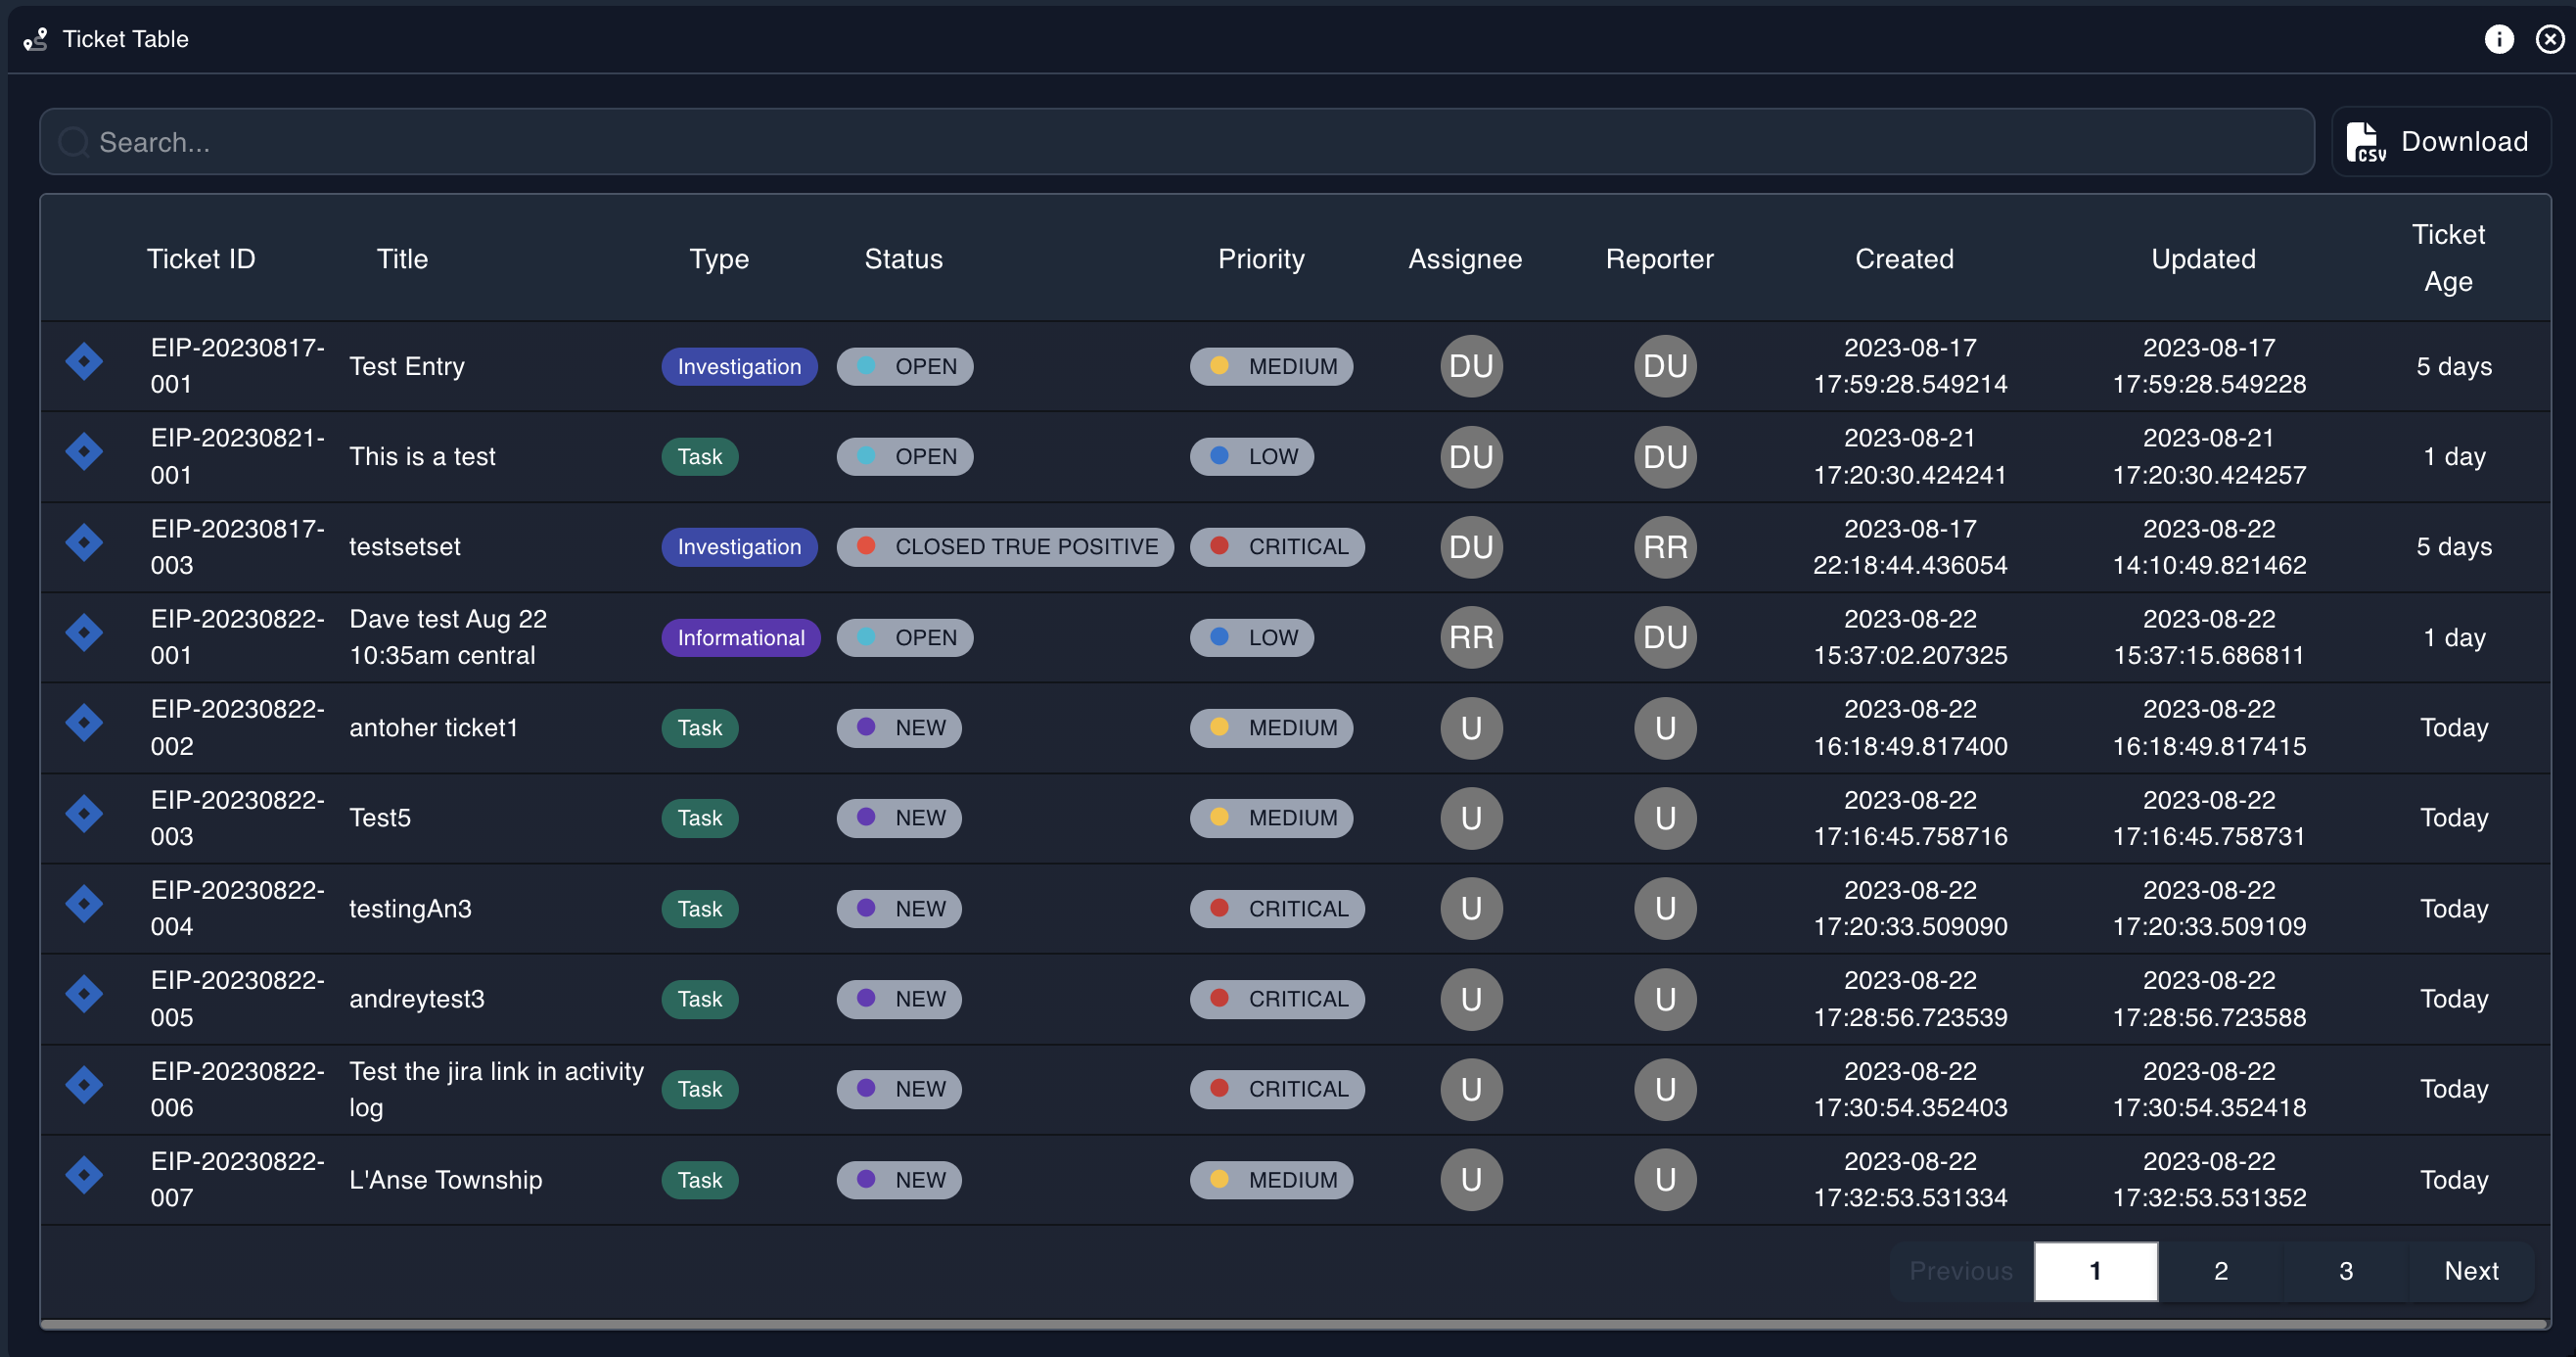
### Ticket Table
The ticket table lists all of your tickets. You can click on column heads to sort by the information in that column. This is useful if you want to view all open tickets first (click on the **Status** column head) or all the tickets assigned to a particular person (click in the **Assignee** column head).
You can also use the **Search** bar to search for certain types of data. For example, you can search for all tickets with a particular word in the **Title**.
Ticket Table
### Tickets Created by Severity
This widget shows the total tickets created today, by severity. On this day, only two tickets were created and their severity is medium.

### Top Active and Inactive Tickets
This widget shows the numer of active and inactive tickets. In this example, there are 15 active tickets and no inactive tickets.

### Total Open Tickets by Priority
This widget shows the number of open tickets, broken out by Priority. You can roll your mouse over the colored areas in the circle and see the number of tickets for each priority. In this example, there are 3 critical (red), 2 high (orange), 7 medium (yellow), and 3 low (blue) open tickets, for a total of 15 open tickets.

### Total Open Tickets by Type
This widget shows the number of open tickets, broken out by Type. You can roll your mouse over the colored areas in the circle and see the number of tickets for each ticket type. In this example, there are 3 change request (turquoise), 2 investigation (blue), 2 information (purple), and 8 task (green) tickets, for a total of 15 tickets.

### Total per Day Open Tickets by Type
This widget shows the number of tickets open each day, by type. In this example, you can see that on 8/23 there is a spike in Report Generation tckets.
### Total per Day Opened VS Closed Tickets
This widget shows the number of tickets opened each day, compared with the number of tickets closed. In this example, you can see that on 8/23 there is a spike of opened tickets.
### Total Tickets by Status
This widget shows the number of tickets by status. You can roll your mouse over the colored areas in the circle and see the number of tickets for each status. In this example, there are 9 new (purple) tickets, 15 open (turquoise) tickets, 1 reopened (light grey) ticket, 1 closed (dark grey) ticket, and 1 closed true positive (red) ticket.

### Velocity
This widget shows how opened and closed tickets average over time. You can see that on 8/22 there was a spike of opened tickets.
 .
{% endhint %}
Epiphany's ticketing system has many ways to show you data about tickets. This information helps you identify trends in the types of issues in your organization.
### New Tickets Today
This widget shows the number of tickets opened today. In this example, only two tickets were opened today. Compare this widget with the **Tickets Created by Severity** widget (below), which shows the same information but also includes a breakdown of the tickets' severity.

### Open Investigation Tickets
This widget shows the number of open investigation tickets.

### Open Risk Approval Tickets
This widget shows the number of open risk approval tickets.

### Ticket Table
The ticket table lists all of your tickets. You can click on column heads to sort by the information in that column. This is useful if you want to view all open tickets first (click on the **Status** column head) or all the tickets assigned to a particular person (click in the **Assignee** column head).
You can also use the **Search** bar to search for certain types of data. For example, you can search for all tickets with a particular word in the **Title**.
.
{% endhint %}
Epiphany's ticketing system has many ways to show you data about tickets. This information helps you identify trends in the types of issues in your organization.
### New Tickets Today
This widget shows the number of tickets opened today. In this example, only two tickets were opened today. Compare this widget with the **Tickets Created by Severity** widget (below), which shows the same information but also includes a breakdown of the tickets' severity.

### Open Investigation Tickets
This widget shows the number of open investigation tickets.

### Open Risk Approval Tickets
This widget shows the number of open risk approval tickets.

### Ticket Table
The ticket table lists all of your tickets. You can click on column heads to sort by the information in that column. This is useful if you want to view all open tickets first (click on the **Status** column head) or all the tickets assigned to a particular person (click in the **Assignee** column head).
You can also use the **Search** bar to search for certain types of data. For example, you can search for all tickets with a particular word in the **Title**.


